Showing posts with label SQL. Show all posts

10/31/24

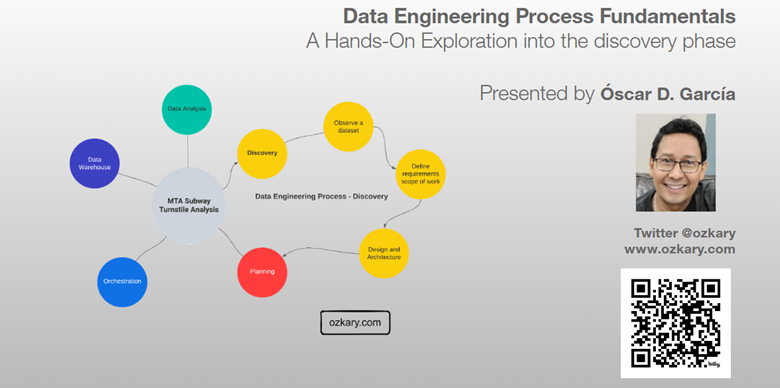
A Hands-On Exploration into the discovery phase - Data Engineering Process Fundamentals

Overview

The discovery process involves identifying the problem, analyzing data sources, defining project requirements, establishing the project scope, and designing an effective architecture to address the identified challenges.

In this session, we will delve into the essential building blocks of data engineering, placing a spotlight on the discovery process. From framing the problem statement to navigating the intricacies of exploratory data analysis (EDA) using Python, VSCode, Jupyter Notebooks, and GitHub, you'll gain a solid understanding of the fundamental aspects that drive effective data engineering projects.

A Hands-On Exploration into the discovery phase - Data Engineering Process Fundamentals

  • Follow this GitHub repo during the presentation: (Give it a star)

👉 https://github.com/ozkary/data-engineering-mta-turnstile

Jupyter Notebook

👉 https://github.com/ozkary/data-engineering-mta-turnstile/blob/main/Step1-Discovery/mta_discovery.ipynb

  • Data engineering Series:

👉 https://www.ozkary.com/2023/03/data-engineering-process-fundamentals.html

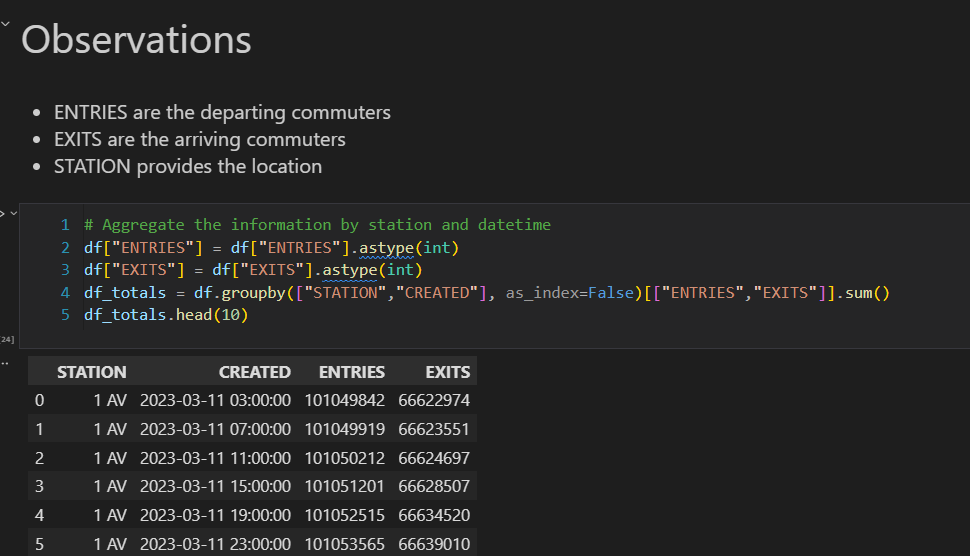
Jupyter Notebook Preview

# Standard library imports
from time import time
from pathlib import Path
import requests
from io import StringIO
# Load pandas support for data analysis tasks, dataframe (two-dimensional data structure with rows and columns) management
import pandas as pd    
import numpy as np 

# URL of the file you want to download. Note: It should be a Saturday date
url = 'http://web.mta.info/developers/data/nyct/turnstile/turnstile_241026.txt'

# Download the file in memory
response = requests.get(url)
response.raise_for_status()  # Check if the request was successful

# Create a DataFrame from the downloaded content
data = StringIO(response.text)
df = pd.read_csv(data)

# Display the DataFrame first 10 rows
df.head(10)

# use info to get the column names, data type and null values
df.info()

# remove spaces and type case the columns
df.columns = [column.strip() for column in df.columns]
print(df.columns)
df["ENTRIES"] = df["ENTRIES"].astype(int)
df["EXITS"] = df["EXITS"].astype(int)

# Define the set of special characters you want to check for
special_characters_set = set('@#$%/')


def has_special_characters(col, special_characters):
    # Check if any character in the column name is not alphanumeric or in the specified set
    return any(char in special_characters for char in col)

def rename_columns(df, special_characters_set):
    # Create a mapping of old column names to new column names
    mapping = {col: ''.join(char for char in col if char.isalnum() or char not in special_characters_set) for col in df.columns}

    print(mapping)
    # Rename columns using the mapping
    df_renamed = df.rename(columns=mapping)

    return df_renamed


# Identify columns with special characters using list comprehension syntax
columns_with_special_characters = [col for col in df.columns if has_special_characters(col, special_characters_set)]

# Print the result
print("Columns with special characters:", columns_with_special_characters)

# Identify columns with special characters and rename them
df = rename_columns(df, special_characters_set)

# Display the data frame again. there should be no column name with special characters
print(df.info())

YouTube Video

Video Agenda

  1. Introduction:

    • Unveiling the importance of the discovery process in data engineering.

    • Setting the stage with a real-world problem statement that will guide our exploration.

  2. Setting the Stage:

    • Downloading and comprehending sample data to kickstart our discovery journey.

    • Configuring the development environment with VSCode and Jupyter Notebooks.

  3. Exploratory Data Analysis (EDA):

    • Delving deep into EDA techniques with a focus on the discovery phase.

    • Demonstrating practical approaches using Python to uncover insights within the data.

  4. Code-Centric Approach:

    • Advocating the significance of a code-centric approach during the discovery process.

    • Showcasing how a code-centric mindset enhances collaboration, repeatability, and efficiency.

  5. Version Control with GitHub:

    • Integrating GitHub seamlessly into our workflow for version control and collaboration.

    • Managing changes effectively to ensure a streamlined data engineering discovery process.

  6. Real-World Application:

    • Applying insights gained from EDA to address the initial problem statement.

    • Discussing practical solutions and strategies derived from the discovery process.

Key Takeaways:

  • Mastery of the foundational aspects of data engineering.

  • Hands-on experience with EDA techniques, emphasizing the discovery phase.

  • Appreciation for the value of a code-centric approach in the data engineering discovery process.

Some of the technologies that we will be covering:

  • Python
  • Data Analysis and Visualization
  • Jupyter Notebook
  • Visual Studio Code

Presentation

Data Engineering Overview

A Data Engineering Process involves executing steps to understand the problem, scope, design, and architecture for creating a solution. This enables ongoing big data analysis using analytical and visualization tools.

Topics

  • Importance of the Discovery Process
  • Setting the Stage - Technologies
  • Exploratory Data Analysis (EDA)
  • Code-Centric Approach
  • Version Control
  • Real-World Use Case

Follow this project: Give a star

👉 Data Engineering Process Fundamentals

Importance of the Discovery Process

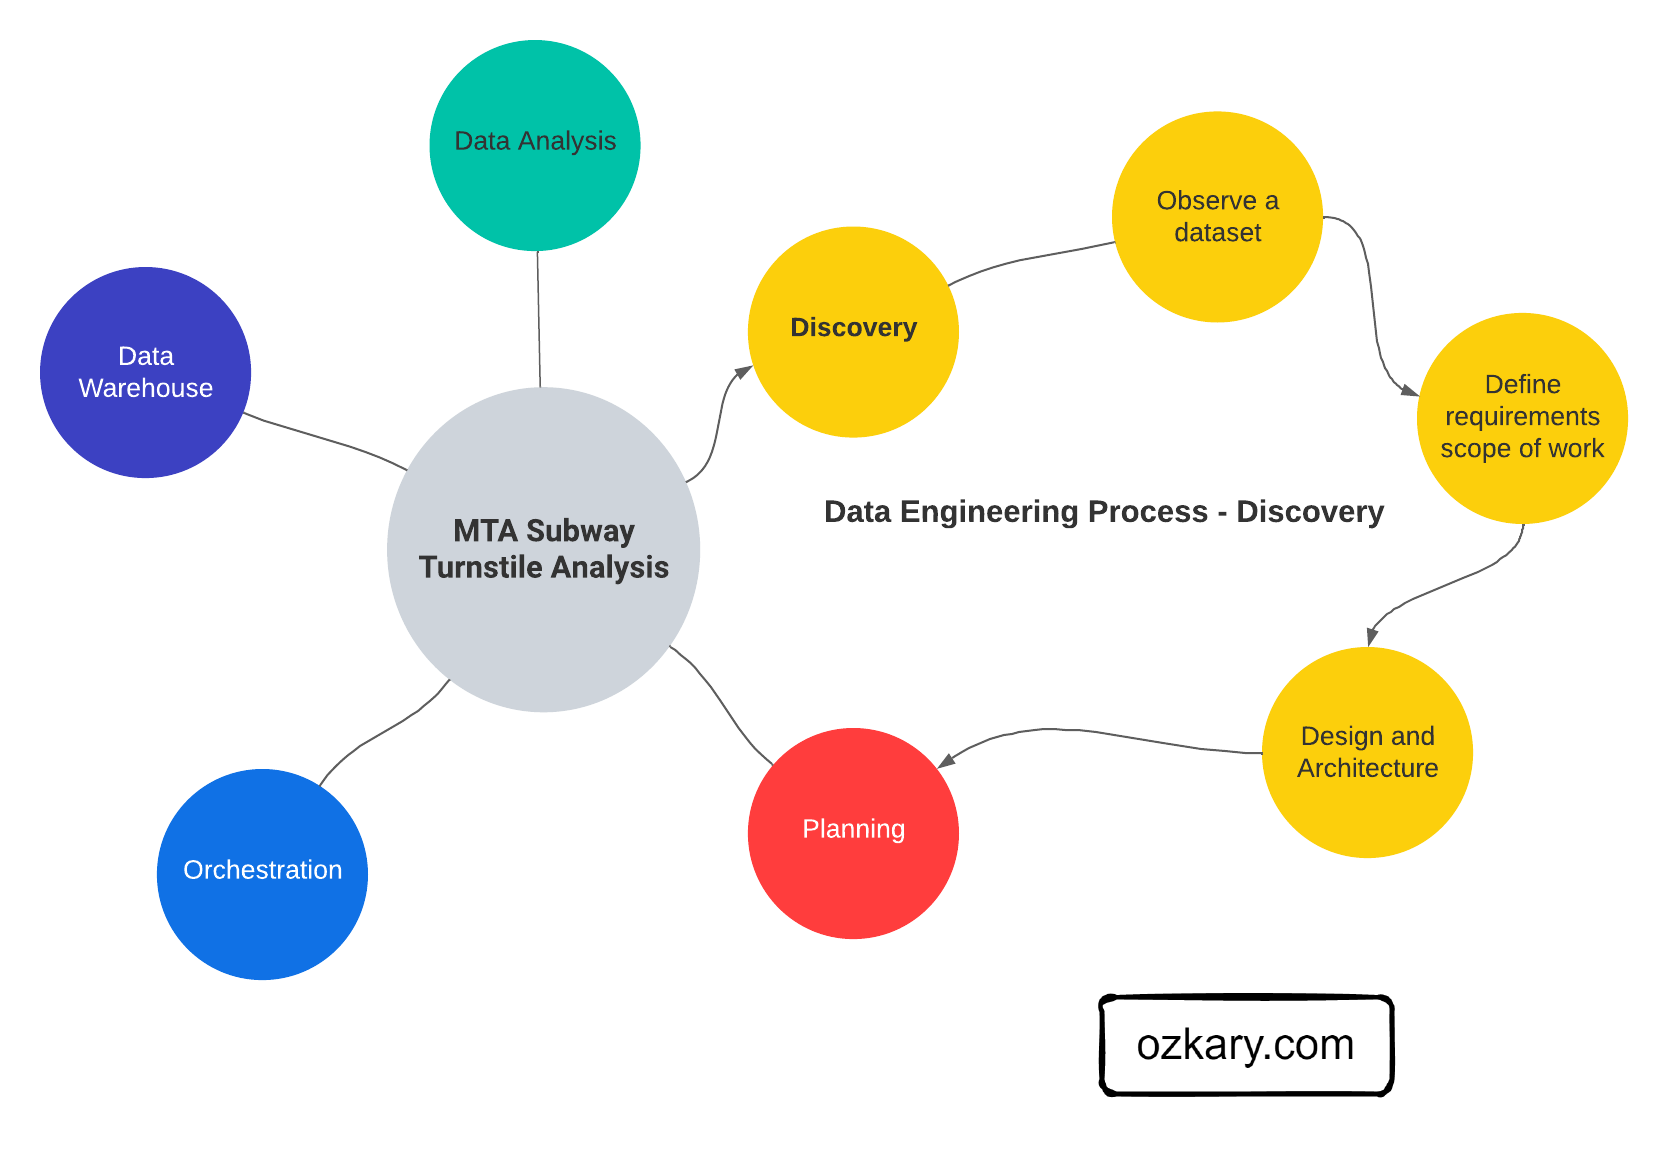
The discovery process involves identifying the problem, analyzing data sources, defining project requirements, establishing the project scope, and designing an effective architecture to address the identified challenges.

  • Clearly document the problem statement to understand the challenges the project aims to address.
  • Make observations about the data, its structure, and sources during the discovery process.
  • Define project requirements based on the observations, enabling the team to understand the scope and goals.
  • Clearly outline the scope of the project, ensuring a focused and well-defined set of objectives.
  • Use insights from the discovery phase to inform the design of the solution, including data architecture.
  • Develop a robust project architecture that aligns with the defined requirements and scope.

Data Engineering Process Fundamentals - Discovery Process

Setting the Stage - Technologies

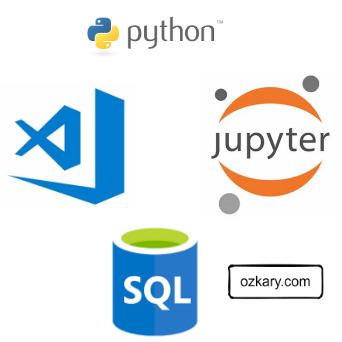
To set the stage, we need to identify and select the tools that can facilitate the analysis and documentation of the data. Here are key technologies that play a crucial role in this stage:

  • Python: A versatile programming language with rich libraries for data manipulation, analysis, and scripting.

Use Cases: Data download, cleaning, exploration, and scripting for automation.

  • Jupyter Notebooks: An interactive tool for creating and sharing documents containing live code, visualizations, and narrative text.

Use Cases: Exploratory data analysis, documentation, and code collaboration.

  • Visual Studio Code: A lightweight, extensible code editor with powerful features for source code editing and debugging.

Use Cases: Writing and debugging code, integrating with version control systems like GitHub.

  • SQL (Structured Query Language): A domain-specific language for managing and manipulating relational databases.

Use Cases: Querying databases, data extraction, and transformation.

Data Engineering Process Fundamentals - Discovery Tools

Exploratory Data Analysis (EDA)

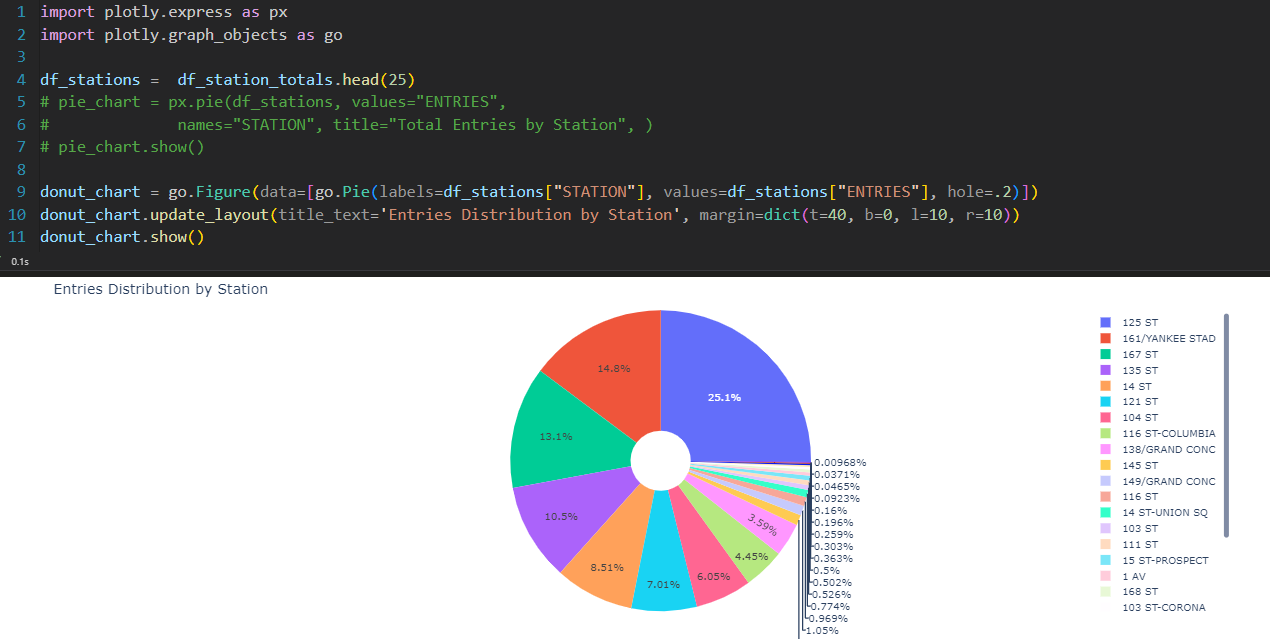
EDA is our go-to method for downloading, analyzing, understanding and documenting the intricacies of the datasets. It's like peeling back the layers of information to reveal the stories hidden within the data. Here's what EDA is all about:

  • EDA is the process of analyzing data to identify patterns, relationships, and anomalies, guiding the project's direction.

  • Python and Jupyter Notebook collaboratively empower us to download, describe, and transform data through live queries.

  • Insights gained from EDA set the foundation for informed decision-making in subsequent data engineering steps.

  • Code written on Jupyter Notebook can be exported and used as the starting point for components for the data pipeline and transformation services.

Data Engineering Process Fundamentals - Discovery Pie Chart

Code-Centric Approach

A code-centric approach, using programming languages and tools in EDA, helps us understand the coding methodology for building data structures, defining schemas, and establishing relationships. This robust understanding seamlessly guides project implementation.

  • Code delves deep into data intricacies, revealing integration and transformation challenges often unclear with visual tools.

  • Using code taps into Pandas and Numpy libraries, empowering robust manipulation of data frames, establishment of loading schemas, and addressing transformation needs.

  • Code-centricity enables sophisticated analyses, covering aggregation, distribution, and in-depth examinations of the data.

  • While visual tools have their merits, a code-centric approach excels in hands-on, detailed data exploration, uncovering subtle nuances and potential challenges.

Data Engineering Process Fundamentals - Discovery Pie Chart

Version Control

Using a tool like GitHub is essential for effective version control and collaboration in our discovery process. GitHub enables us to track our exploratory code and Jupyter Notebooks, fostering collaboration, documentation, and comprehensive project management. Here's how GitHub enhances our process:

  • Centralized Tracking: GitHub centralizes tracking and managing our exploratory code and Jupyter Notebooks, ensuring a transparent and organized record of our data exploration.

  • Sharing: Easily share code and Notebooks with team members on GitHub, fostering seamless collaboration and knowledge sharing.

  • Documentation: GitHub supports Markdown, enabling comprehensive documentation of processes, findings, and insights within the same repository.

  • Project Management: GitHub acts as a project management hub, facilitating CI/CD pipeline integration for smooth and automated delivery of data engineering projects.

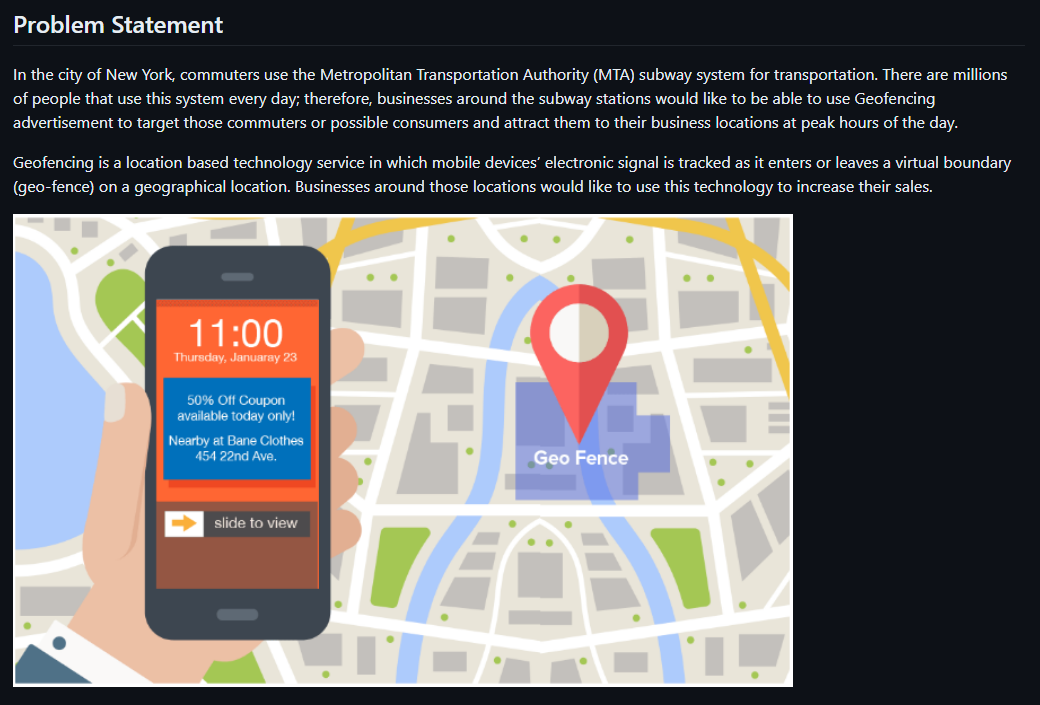
Data Engineering Process Fundamentals - Discovery Problem Statement

Summary: The Power of Discovery

By mastering the discovery phase, you lay a strong foundation for successful data engineering projects. A thorough understanding of your data is essential for extracting meaningful insights.

  • Understanding Your Data: The discovery phase is crucial for understanding your data's characteristics, quality, and potential.
  • Exploratory Data Analysis (EDA): Use techniques to uncover patterns, trends, and anomalies.
  • Data Profiling: Assess data quality, identify missing values, and understand data distributions.
  • Data Cleaning: Address data inconsistencies and errors to ensure data accuracy.
  • Domain Knowledge: Leverage domain expertise to guide data exploration and interpretation.
  • Setting the Stage: Choose the right language and tools for efficient data exploration and analysis.

The data engineering discovery process involves defining the problem statement, gathering requirements, and determining the scope of work. It also includes a data analysis exercise utilizing Python and Jupyter Notebooks or other tools to extract valuable insights from the data. These steps collectively lay the foundation for successful data engineering endeavors.

Thanks for reading.

Send question or comment at Twitter @ozkary 👍 Originally published by ozkary.com

9/25/24

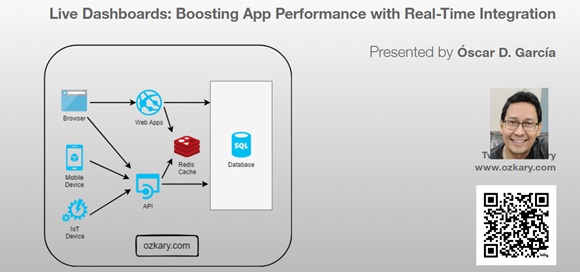
Live Dashboards: Boosting App Performance with Real-Time Integration

Overview

Dive into the future of web applications. We're moving beyond traditional API polling and embracing real-time integration. Imagine your client app maintaining a persistent connection with the server, enabling bidirectional communication and live data streaming. We'll also tackle scalability challenges and integrate Redis as our in-memory data solution.

Live Dashboards: Boosting App Performance with Real-Time Integration

  • Follow this GitHub repo during the presentation: (Give it a star)

👉 https://github.com/ozkary/Realtime-Apps-with-Nodejs-Angular-Socketio-Redis

YouTube Video

Video Agenda

This presentation explores strategies for building highly responsive and interactive live dashboards. We'll delve into the challenges of traditional API polling and demonstrate how to leverage Node.js, Angular, Socket.IO, and Redis to achieve real-time updates and a seamless user experience.

  • Introduction:

    • Understanding telemetry data and the importance to monitor the data
    • Challenges of traditional API polling for real-time data.
    • Design patterns to enhance an app with minimum changes
  • Traditional Solution Architecture

    • SQL Database Integration.
    • Restful API
    • Angular and Node.js Integration
  • Real-Time Integration with Web Sockets

    • Database Optimization Challenges
    • Introduction to Web Sockets for bidirectional communication.
    • Implementing Web Sockets in a Web application.
    • Handling data synchronization and consistency.
  • Distributed Caching with Redis:

    • Benefits of in-memory caching for improving performance and scalability.
    • Integrating Redis into your Node.js application.
    • Caching strategies for distributed systems.
  • Case Study: Building a Live Telemetry Dashboard

    • Step-by-step demonstration of the implementation.
    • Performance comparison with and without optimization techniques.
    • User experience benefits of real-time updates.
  • Benefits and Considerations

    • Improved dashboard performance and responsiveness.
    • Reduced server load and costs.
    • Scalability and scalability considerations.
    • Best practices for implementing real-time updates.

Why Attend:

Gain a deep understanding of real-time data integration for your Web application.

Presentation

Telemetry Data Story

Devices send telemetry data via API integration with SQL Server. There are inherit performance problems with a disk-based database. We progressively enhance the system with minimum changes by adding real-time integration and an in-memory cache system.

Live Dashboards: Real-time dashboard

Database Integration

Solution Architecture

  • Disk-based Storage
  • Web apps and APIs query database to get the data
  • Applications can do both high reads and writes
  • Web components, charts polling back-end database for reads

Let’s Start our Journey

  • Review our API integration and talk about concerns
  • Do not refactor everything
  • Enhance to real-time integration with sockets
  • Add Redis as the distributed cache
  • Add the service broker strategy to sync the data sources
  • Centralized the real-time integration with Redis

Live Dashboards: Direct API Integration

RESTful API Integration

Applied Technologies

  • REST API Written with Node.js
  • TypeORM Library Repository
  • Angular Client Application with Plotly.js Charts
  • Disk-based storage – SQL Server
  • API Telemetry (GET, POST) route

Use Case

  • IoT devices report telemetry information via API
  • Dashboard reads that most recent data only via API calls which queries the storage service
  • Polling the database to get new records

Project Repo (Star the project and follow) https://github.com/ozkary/Realtime-Apps-with-Nodejs-Angular-Socketio-Redis

Live Dashboards: Repository Integration

Database Optimization and Challenges

Slow Queries on disk-based storage

  • Effort on index optimization
  • Database Partition strategies
  • Double-digit millisecond average speed (physics on data disks)

Simplify data access strategies

  • Relational data is not optimal for high data read systems (joins?)
  • Structure needs to be de-normalized
  • Often views are created to shape the data, date range limit

Database Contention

  • Read isolation levels (nolock)
  • Reads competing with inserts

Cost to Scale

  • Vertical and horizontal scaling up on resources
  • Database read-replicas to separate reads and writes
  • Replication workloads/tasks
  • Data lakes and data warehouse

Live Dashboards: SQL Query

Real-Time Integration

What is Socket.io, Web Sockets?

  • Enables real-time bidirectional communication.
  • Push data to clients as events take place on the server
  • Data streaming
  • Connection starts as HTTP is them promoted to Web Sockets

Additional Technologies -Socket.io (Signalr for .Net) for both client and server components

Use Case

  • IoT devices report telemetry information via sockets. All subscribed clients get the information as an event which updates the dashboard

Demo

  • Update both server and client to support Web sockets
  • Use device demo tool to connect and automate the telemetry data to the server

Live Dashboards: Web Socket Integration

Distributed Cache Strategy

Why Use a Cache?

  • Data is stored in-memory
  • Sub-millisecond average speed
  • Cache-Aside Pattern
    • Read from cache first (cache-hit) fail over to database (cache miss)
    • Update cache on cache miss
  • Write-Through
    • Write to cache and database
    • Maintain both systems updated
  • Improves app performance
  • Reduces load on Database

Application Changes

  • Changes are only done on the server
  • No changes on client-side

Live Dashboards: Cache Architecture

Redis and Socket.io Integration

What is Redis?

  • Key-value store, keys can contain strings (JSON), hashes, lists, sets, & sorted sets
  • Redis supports a set of atomic operations on these data types (available until committed)
  • Other features include transactions, publish/subscribe, limited time to live -TTL
  • You can use Redis from most of today's programming languages using libraries

Use Case

  • As application load and data frequency increases, we need to use a cache for performance. We also need to centralize the events, so all the socket servers behind a load balancer can notify the clients. Update both storage and cache

Demo

  • Start Redis-cli on Ubuntu and show some inserts, reads and sync events.
    • sudo service redis-server restart
    • redis-cli -c -p 6379 -h localhost
    • zadd table:data 100 "{data:'100'}“
    • zrangebycore table:data 100 200
    • subscribe telemetry:data

Live Dashboards: Load Balanced Architecture

Summary: Boosting Your App Performance

When your application starts to slow down due to heavy read and writes on your database, consider moving the read operations to a cache solution and broadcasting the data to your application via a real-time integration using Web Sockets. This approach can significantly enhance performance and user experience.

Key Benefits

  • Improved Performance: Offloading reads to a cache system like Redis reduces load on the database.
  • Real-Time Updates: Using Web Sockets ensures that your application receives updates in real-time, with no need for manual refreshes.
  • Scalability: By reducing the database load, your application can handle more concurrent users.
  • Efficient Resource Utilization: Leveraging caching and real-time technologies optimizes the user of server resources, leading to savings and better performance.

Live Dashboards: Load Balanced Architecture

We've covered a lot today, but this is just the beginning!

If you're interested in learning more about building cloud data pipelines, I encourage you to check out my book, 'Data Engineering Process Fundamentals,' part of the Data Engineering Process Fundamentals series. It provides in-depth explanations, code samples, and practical exercises to help in your learning.

Data Engineering Process Fundamentals - Book by Oscar Garcia Data Engineering Process Fundamentals - Book by Oscar Garcia

Thanks for reading.

Send question or comment at Twitter @ozkary 👍 Originally published by ozkary.com

4/3/24

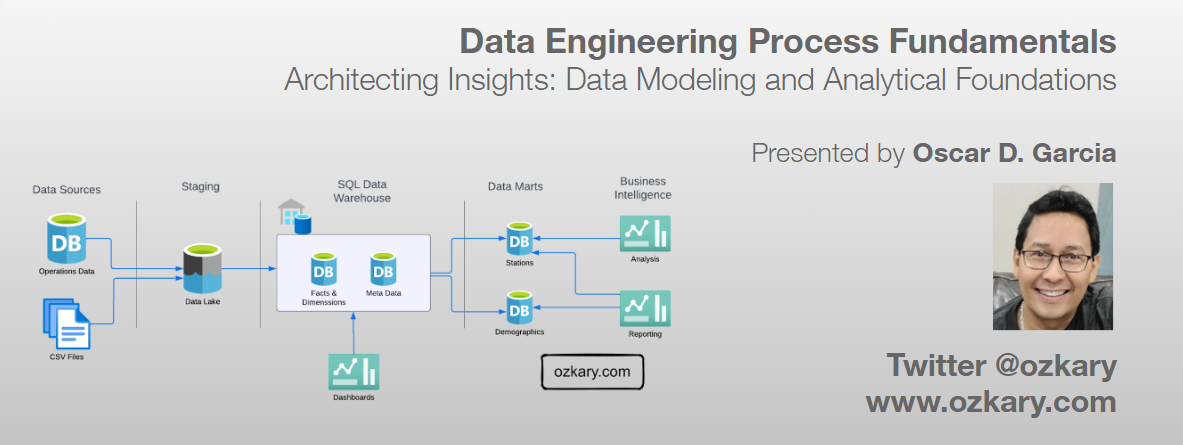
Architecting Insights: Data Modeling and Analytical Foundations - Data Engineering Process Fundamentals

Overview

A Data Warehouse is an OLAP system, which serves as the central data repository for historical and aggregated data. A data warehouse is designed to support complex analytical queries, reporting, and data analysis for Big Data use cases. It typically adopts a denormalized entity structure, such as a star schema or snowflake schema, to facilitate efficient querying and aggregations. Data from various OLTP sources is extracted, loaded and transformed (ELT) into the data warehouse to enable analytics and business intelligence. The data warehouse acts as a single source of truth for business users to obtain insights from historical data.

In this technical presentation, we embark on the next chapter of our data journey, delving into data modeling and building our data warehouse.

Data Engineering Process Fundamentals - Data Warehouse Design

  • Follow this GitHub repo during the presentation: (Give it a star)

👉 https://github.com/ozkary/data-engineering-mta-turnstile

  • Read more information on my blog at:

👉 https://www.ozkary.com/2023/03/data-engineering-process-fundamentals.html

YouTube Video

Video Agenda

Building on our previous exploration of data pipelines and orchestration, we now delve into the pivotal phase of data modeling and analytics. In this continuation of our data engineering process series, we focus on architecting insights by designing and implementing data warehouses, constructing logical and physical models, and optimizing tables for efficient analysis. Let's uncover the foundational principles driving effective data modeling and analytics.

Agenda:

  • Operational Data Concepts:

    • Explanation of operational data and its characteristics.
    • Discussion on data storage options, including relational databases and NoSQL databases.
  • Data Lake for Data Staging:

    • Introduction to the concept of a data lake as a central repository for raw, unstructured, and semi-structured data.
    • Explanation of data staging within a data lake for ingesting, storing, and preparing data for downstream processing.
    • Discussion on the advantages of using a data lake for data staging, such as scalability and flexibility.
  • Data Warehouse for Analytical Data:

    • Overview of the role of a data warehouse in storing and organizing structured data for analytics and reporting purposes.
    • Discussion on the benefits of using a data warehouse for analytical queries and business intelligence.
  • Data Warehouse Design and Implementation:

    • Introduction to data warehouse design principles and methodologies.
    • Explanation of logical models for designing a data warehouse schema, including conceptual and dimensional modeling.
  • Star Schema:

    • Explanation of the star schema design pattern for organizing data in a data warehouse.
    • Discussion on fact tables, dimension tables, and their relationships within a star schema.
    • Explanation of the advantages of using a star schema for analytical querying and reporting.
  • Logical Models:

    • Discussion on logical models in data warehouse design.
    • Explanation of conceptual modeling and entity-relationship diagrams (ERDs).
  • Physical Models - Table Construction:

    • Discussion on constructing tables from the logical model, including entity mapping and data normalization.
    • Explanation of primary and foreign key relationships and their implementation in physical tables.
  • Table Optimization Index and Partitions:

    • Introduction to table optimization techniques for improving query performance.
    • Explanation of index creation and usage for speeding up data retrieval.
    • Discussion on partitioning strategies for managing large datasets and enhancing query efficiency.
  • Incremental Strategy:

    • Introduction to incremental loading techniques for efficiently updating data warehouses.
    • Explanation of delta processing.
    • Discussion on the benefits of incremental loading in reducing processing time and resource usage.
  • Orchestration and Operations:

    • Tools and frameworks for orchestrating data pipelines, such as dbt.
    • Discussion on the importance of orchestration and monitoring the data processing tasks.
    • Policies to archive data in blob storage.

Why join this session?

  • Learn analytical data modeling essentials.
  • Explore schema design patterns like star and snowflake.
  • Optimize large dataset management and query efficiency.
  • Understand logical and physical modeling strategies.
  • Gain practical insights and best practices.
  • Engage in discussions with experts.
  • Advance your data engineering skills.
  • Architect insights for data-driven decisions.

Presentation

Data Engineering Overview

A Data Engineering Process involves executing steps to understand the problem, scope, design, and architecture for creating a solution. This enables ongoing big data analysis using analytical and visualization tools.

Data Engineering Process Fundamentals - Operational Data

Topics

  • Operational Data
  • Data Lake
  • Data Warehouse
  • Schema and Data Modeling
  • Data Strategy and Optimization
  • Orchestration and Operations

Follow this project: Star/Follow the project

👉 Data Engineering Process Fundamentals

Operational Data

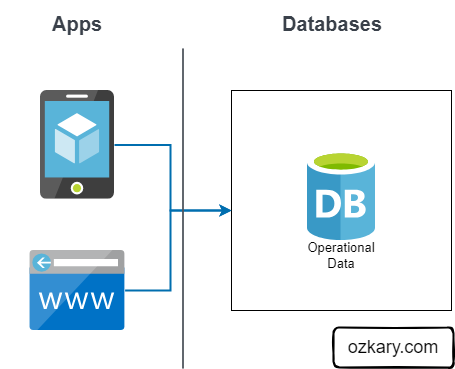
Operational data (OLTP) is often generated by applications, and it is stored in transactional relational databases like SQL Server, Oracle and NoSQL (JSON) databases like CosmosDB, Firebase. This is the data that is created after an application saves a user transaction like contact information, a purchase or other activities that are available from the application.

Features

  • Application support and transactions
  • Relational data structure and SQL or document structure NoSQL
  • Small queries for case analysis

Not Best For:

  • Reporting and analytical systems (OLAP)
  • Large queries
  • Centralized Big Data system

Data Engineering Process Fundamentals - Operational Data

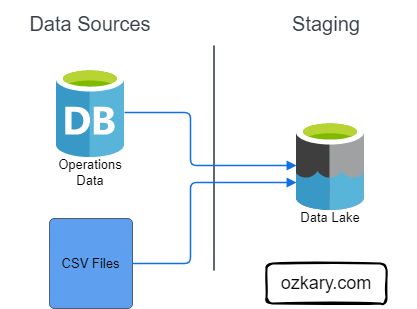
Data Lake - From Ops to Analytical Data Staging

A Data Lake is an optimized storage system for Big Data scenarios. The primary function is to store the data in its raw format without any transformation. Analytical data is the transaction data that has been extracted from a source system via a data pipeline as part of the staging data process.

Features:

  • Store the data in its raw format without any transformation
  • This can include structure data like CSV files, unstructured data like JSON and XML documents, or column-base data like parquet files
  • Low Cost for massive storage power
  • Not Designed for querying or data analysis
  • It is used as external tables by most systems

Data Engineering Process Fundamentals - Data Lake for Staging the data

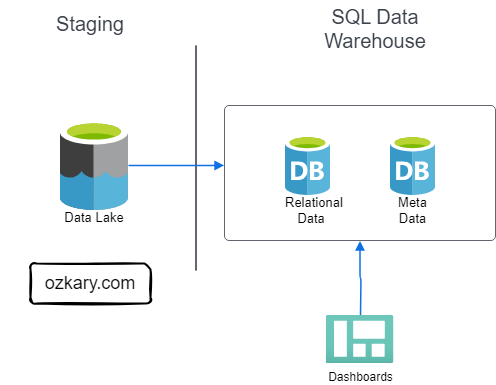
Data Warehouse - Staging to Analytical Data

A Data Warehouse, OLAP system, is a centralized storage system that stores integrated data from multiple sources. The system is designed to host and serve Big Data scenarios with lower operational cost than transaction databases, but higher costs than a Data Lake.

Features:

  • Stores historical data in relational tables with an optimized schema, which enables the data analysis process
  • Provides SQL support to query and transform the data
  • Integrates external resources on Data Lakes as external tables
  • The system is designed to host and serve Big Data scenarios.
  • Storage is more expensive
  • Offloads archived data to Data Lakes

Data Engineering Process Fundamentals - Data Warehouse Analytical Data

Data Warehouse - Design and Implementation

In the design phase, we lay the groundwork by defining the database system, schema model, logical data models, and technology stack (SQL, Python, frameworks and tools) required to support the data warehouse’s implementation and operations.

In the implementation phase, we focus on converting logical data models into a functional system. By creating concrete structures like dimension and fact tables and performing data transformation tasks, including data cleansing, integration, and scheduled batch loading, we ensure that raw data is processed and unified for analysis.

Data Engineering Process Fundamentals - Data Warehouse Design

Design - Schema Modeling

The Star and Snowflake Schemas are two common data warehouse modeling techniques. The Star Schema consist of a central fact table is connected to multiple dimension tables via foreign key relationships. The Snowflake Schema is a variation of the Star Schema, but with dimension tables that are further divided into multiple related tables.

What to use:

  • Use the Star Schema when query performance is a primary concern, and data model simplicity is essential

  • Use the Snowflake Schema when storage optimization is crucial, and the data model involves high-cardinality dimension attributes with potential data redundancy

Data Engineering Process Fundamentals - Data Warehouse Schema Model

Data Modeling

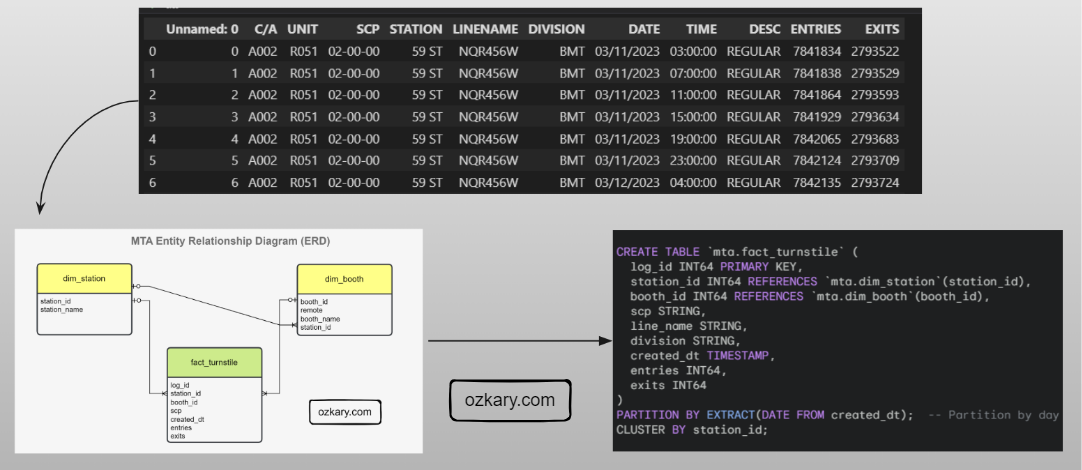
Data modeling lays the foundation for a data warehouse. It starts with modeling raw data into a logical model outlining the data and its relationships, with a focus based on data requirements. This model is then translated, using DDL, into the specific views, tables, columns (data types), and keys that make up the physical model of the data warehouse, with a focus on technical requirements.

Data Engineering Process Fundamentals - Data Warehouse Data Model

Data Optimization to Deliver Performance

To achieve faster queries, improve performance and reduce resource cost, we need to efficiently organize our data. Two key techniques for accomplishing this are data partitioning and data clustering.

  • Data Partitioning: Imagine dividing your data table into smaller, self-contained segments based on a specific column (e.g., date). This allows the DW to quickly locate and retrieve only the relevant data for your queries, significantly reducing scan times.

  • Data Clustering: Allows us to organize the data within each partition based on another column (e.g., Station). This groups frequently accessed data together physically, leading to faster query execution, especially for aggregations or filtering based on the clustered column.

Data Engineering Process Fundamentals - Data Warehouse DDL Script

Data Transformation and Incremental Strategy

The data transformation phase is a critical stage in a data warehouse project. This phase involves several key steps, including data extraction, cleaning, loading, data type casting, use of naming conventions, and implementing incremental loads to continuously insert the new information since the last update via batch processes.

Data Engineering Process Fundamentals - Data Warehouse Data Lineage

  • Data Lineage: Tracks the flow of data from its origin to its destination, including all the intermediate processes and transformations that it undergoes.

Orchestration and Operations

Effective orchestration and operation are the keys of a reliable and efficient data project. They streamline data pipelines, ensure data quality, and minimize human intervention. This translates to faster development cycles, reduced errors, and improved overall data management.

  • Version Control and CI/CD with GitHub: Enables development, automated testing, and seamless deployment of data pipelines.

  • Documentation: Maintain clear and comprehensive documentation covering data pipelines, data quality checks, scheduling, data archiving policies

  • Scheduling and Automation: Automates repetitive tasks, such as data ingestion, transformation, and archiving processes,

  • Monitoring and Notification: Provides real-time insights into pipeline health, data quality, and archiving success

Data Engineering Process Fundamentals - Data Warehouse Data Lineage

Summary

Before we can move data into a data warehouse system, we explore two pivotal phases for our data warehouse solution: design and implementation. In the design phase, we lay the groundwork by defining the database system, schema and data model, and technology stack required to support the data warehouse’s implementation and operations. This stage ensures a solid infrastructure for data storage and management.

In the implementation phase, we focus on converting conceptual data models into a functional system. By creating concrete structures like dimension and fact tables and performing data transformation tasks, including data cleansing, integration, and scheduled batch loading, we ensure that raw data is processed and unified for analysis.

Thanks for reading.

Send question or comment at Twitter @ozkary

👍 Originally published by ozkary.com

10/25/23

Data Engineering Process Fundamentals - Unveiling the Power of Data Lakes and Data Warehouses


In this technical presentation, we will delve into the fundamental concepts of Data Engineering, focusing on two pivotal components of modern data architecture - Data Lakes and Data Warehouses. We will explore their roles, differences, and how they collectively empower organizations to harness the true potential of their data.

- Follow this GitHub repo during the presentation: (Give it a star)


- Read more information on my blog at:


Presentation


YouTube Video


1. Introduction to Data Engineering:
- Brief overview of the data engineering landscape and its critical role in modern data-driven organizations.

2. Understanding Data Lakes:
- Explanation of what a data lake is and its purpose in storing vast amounts of raw and unstructured data.

3. Exploring Data Warehouses:
- Definition of data warehouses and their role in storing structured, processed, and business-ready data.

4. Comparing Data Lakes and Data Warehouses:
- Comparative analysis of data lakes and data warehouses, highlighting their strengths and weaknesses.
- Discussing when to use each based on specific use cases and business needs.

5. Integration and Data Pipelines:
- Insight into the seamless integration of data lakes and data warehouses within a data engineering pipeline.
- Code walkthrough showcasing data movement and transformation between these two crucial components.

6. Real-world Use Cases:
- Presentation of real-world use cases where effective use of data lakes and data warehouses led to actionable insights and business success.
- Hands-on demonstration using Python, Jupyter Notebook and SQL to solidify the concepts discussed, providing attendees with practical insights and skills.


Conclusion:

This session aims to equip attendees with a strong foundation in data engineering, focusing on the pivotal role of data lakes and data warehouses. By the end of this presentation, participants will grasp how to effectively utilize these tools, enabling them to design efficient data solutions and drive informed business decisions.

This presentation will be accompanied by live code demonstrations and interactive discussions, ensuring attendees gain practical knowledge and valuable insights into the dynamic world of data engineering.

Some of the technologies that we will be covering:

- Data Lakes
- Data Warehouse
- Data Analysis and Visualization
- Python
- Jupyter Notebook
- SQL

Send question or comment at Twitter @ozkary

Originally published by ozkary.com

6/17/23

Data Engineering Process Fundamentals - Data Warehouse and Transformation Exercise

In this hands-on lab, we build upon our data engineering process where we previously focused on defining a data pipeline orchestration process. Now, we should focus on storing and making the data accessible for visualization and analysis. So far, our data is stored in a Data Lake, while Data Lakes excel at handling vast volumes of data, they are not optimized for query performance, so our step is to enable the bulk data processing and analytics by working on our Data Warehouse (DW).

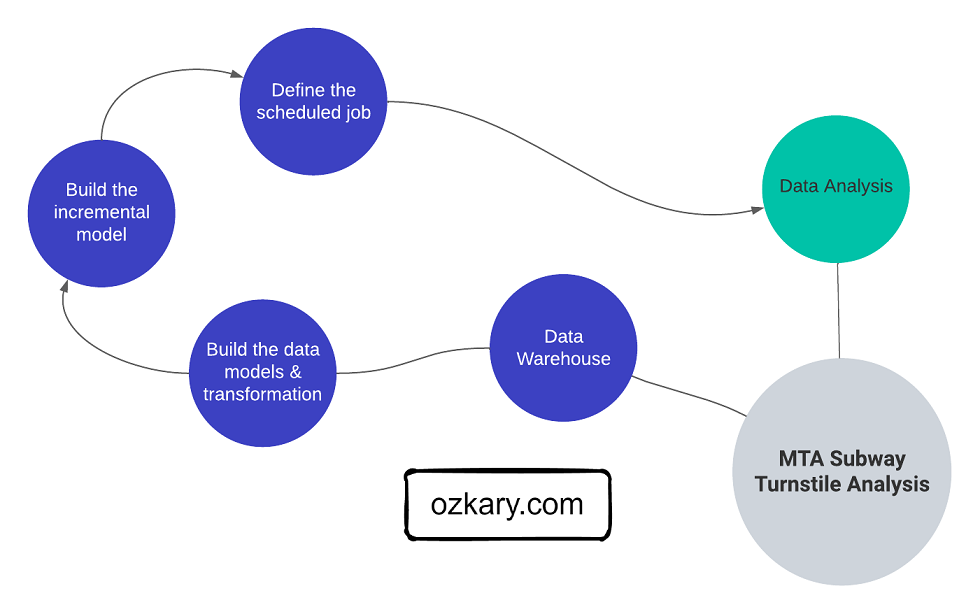
During this exercise, we delve into the data warehouse design and implementation step, crafting robust data models, and designing transformation tasks. We explore how to efficiently load, cleanse, and merge data, ultimately creating dimension and fact tables. Additionally, we discuss areas like query performance, testability, and source control of our code, ensuring a reliable and scalable data solution. By leveraging incremental models, we continuously update our data warehouse with only the deltas (new updates), optimizing query performance and enhancing the overall data pipeline. By the end, we have a complete data pipeline, taking data from CSV to our data warehouse, equipped for seamless visualization and analysis.

Data Warehouse Design

A data warehouse is an OLAP system, which serves as the central data repository for historical and aggregated data. In contrast to the ETL process employed by data lakes with Python code, a data warehouse relies on the ETL process. This fundamental distinction emphasizes the need for well-defined and optimized models within the database, enabling efficient data access and exceptional performance.

👍 For the ETL process, the data is transformed before adding it to storage. For the ELT process, the data is first loaded in storage in its raw format, the transformation is then done before inserting into the dimension and fact tables.

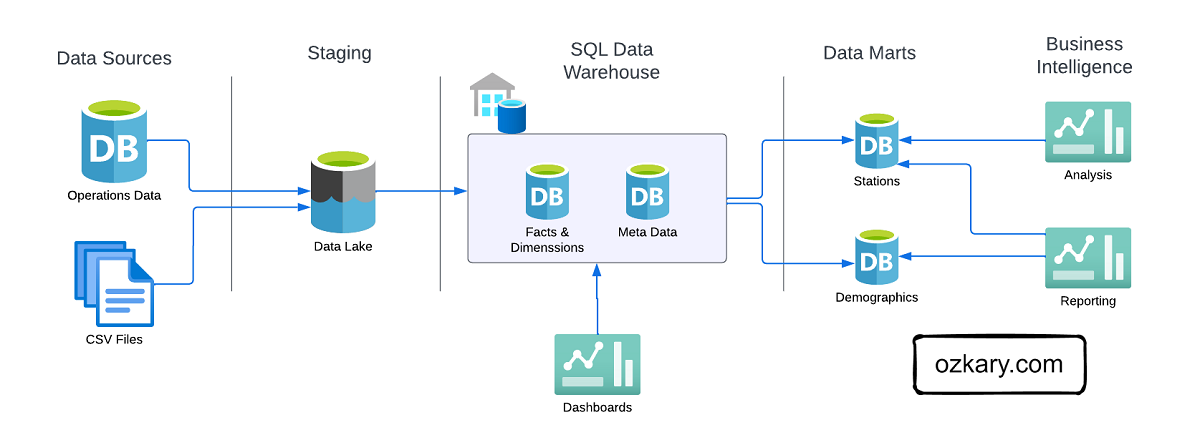
Before building the concrete tables, our initial focus is on creating precise data models based on thorough analysis and specific requirements. To achieve this, we leverage SQL (Structured Query Language) and tools that facilitate model development in an automated, testable, and repeatable manner. By incorporating such tools into our project, we build the data services area in which we manage the data modeling and transformation to expand our architecture into the following:
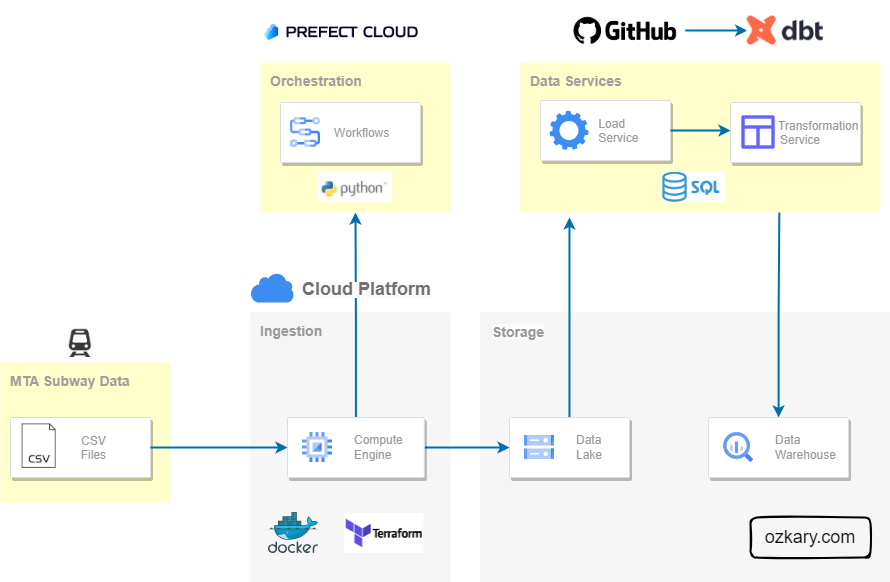
ozkary-data-engineering-data-warehouse-architecture

👉 For our use case, we are using Google BigQuery as our data warehouse system. Make sure to review the Data Engineering Process - Design and Planning section and run the Terraform script to provision this resource.

External Tables

An external table is not physically hosted within the data warehouse database. Since our raw data is stored on a data lake, we can reference that location and load those files as an external table. we can create an external table using the data lake files as the source by providing a file pattern to select all the compressed files.

The following SQL can be executed as a query on the data warehouse. Access to the data lake should already be configured when the service accounts where assigned to the resources during the design and planning phase.

CREATE OR REPLACE EXTERNAL TABLE mta_data.ext_turnstile
OPTIONS (
  format = 'CSV',
  uris = ['gs://ozkary_data_lake_ozkary-de-101/turnstile/*.csv.gz']  
);

When this SQL script is executed, and the external table is created, the data warehouse retrieves the metadata about the external data, such as the schema, column names, and data types, without actually moving the data into the data warehouse storage. Once the external table is created, we can query the data using SQL as if it were a regular table.

Design and Architecture

During the design and architecture stage of our data warehouse project, our primary objective is to transition from conceptual ideas to concrete designs. Here, we make pivotal technical choices that pave the way for building the essential resources and defining our data warehouse approach.

Star Schema

We start by selecting the Star Schema model. This model consist of a central fact table that is connected to multiple dimension tables via foreign key relationships. The fact table contains the measures or metrics, while the dimension tables hold descriptive attributes.

Infrastructure

For the infrastructure, we are using a cloud hosted OLAP system, Google BigQuery. This is a system that can handle petabytes of data. It also provides MPP (Massive Parallel Processing), built-in indexing and caching, which improves query performance and reduce compute by caching query results. The serverless architecture of these systems help us on reducing cost. Because the system is managed by the cloud provider, we can focus on the data analysis instead of infrastructure management.

Technology Stack

For the technology stack, we are using a SQL-centric approach. We want to be able to manage our models and transformation tasks within the memory context and processing power of the database, which tends to work best for large datasets and faster processing. In addition, this approach works well with a batch processing approach.

dbt (data build tool) is a SQL-centric framework which at its core is primarily focused on transforming data using SQL-based queries. It allows us to define data models and transformation logic using SQL and Jinja, a templating language with data transformation capabilities, such as loops, conditionals, and macros, within our SQL code. This framework enables us to build the actual data models as views, tables and SQL based transformation that are hosted on the data warehouse.

As we build code for our data model and transformation tasks, we need to track it, manage the different versions and automate the deployments to our database. To manage this, we use GitHub, which is a web-based platform that provides version control and collaborative features for software development and management. It also provides CI/CD capabilities to help us execute test plans, build releases and deploy them. dbt connects with GitHub to manage deployments. This enables the dbt orchestration features to run the latest code as part of the pipeline.

👍 A deployment consists of getting the latest model metadata, build it on the database, and run the incremental data tasks when new data is available in the data lake.

Data Warehouse Implementation

The data warehouse implementation is the stage where the conceptual data model and design plans are transformed into a functional system by implementing the data models and writing the code for our transformation tasks.

Data Modeling

Data modeling is the implementation of the structure of the data warehouse, creating models (views) and entities (tables), defining attributes (columns), and establishing data relationships to ensure efficient querying and reporting. It is also important to identify the primary keys, foreign keys, and indexes to improve data retrieval performance.

To build our models, we should follow these specifications:

  • Create an external table using the Data Lake folder and *.csv.gz file pattern as a source
    • ext_turnstile
  • Create the staging models
    • Create the station view (stg_station) from the external table as source
      • Get the unique stations
      • Create a surrogate key using the station name
    • Create the booth view (stg_booth) from the external table as source
      • Create a surrogate key using the booth UNIT and CA fields
    • Create the fact view (stg_turnstile) from the external table as source
      • Create a surrogate key using CA, UNIT, SCP, DATE, time

Data Transformation

The data transformation phase is a critical stage in a data warehouse project. This phase involves several key steps, including data extraction, cleaning, loading, data type casting, use naming conventions, and implementing incremental loads to continuously insert the new information since the last update via batch processes.

For our transformation services, we follow these specifications:

  • Use the staging models to build the physical models
    • Map all the columns to our naming conventions, lowercase and underline between words
    • Create the station dimension table (dim_station) from the stg_station model
      • Add incremental strategy for ongoing new data
    • Create the booth dimension table (dim_booth) from the stg_booth model
      • Add incremental strategy for ongoing new data
      • Use the station_name to get the foreign key, station_id
      • Cluster the table by station_id
    • Create the fact table (fact_turnstile) from the stg_turnstile model
      • Add incremental strategy for ongoing new data
      • Partition the table by created_dt and use day granularity
      • Cluster the table by station_id
      • Join on dimension tables to use id references instead of text
  • Remove rows with null values for the required fields
    • Station, CA, UNIT, SCP, DATE, TIME
  • Cast columns to the correct data types
    • created
  • Continuously run all the model with an incremental strategy to append new records

Our physical data model should look like this:
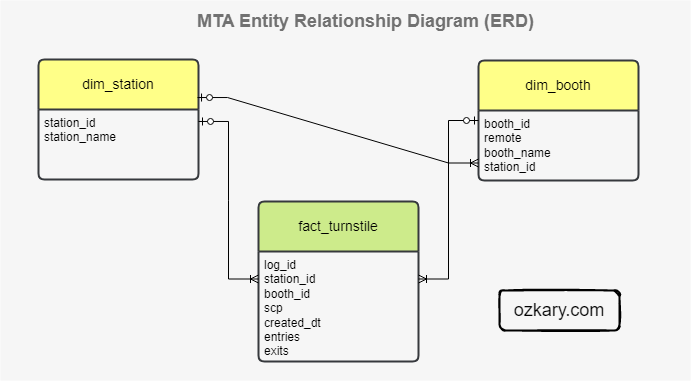
ozkary-data-engineering-data-warehouse-star-schema

Why do we use partitions and cluster

👍 We should always review the technical specifications of the database system to find out what other best practices are recommended to improve performance.

  • Partitioning is the process of dividing a large table into smaller, more manageable parts based on the specified column. Each partition contains rows that share a common value like a specific date. A partition improves performance and query cost

  • When we run a query in BigQuery, it gets executed by a distributed computing infrastructure that spans multiple machines. Clustering is an optional feature in BigQuery that allows us to organize the data within each partition. The purpose of clustering is to physically arrange data within a partition in a way that is conducive to efficient query processing

SQL Server and Big Query Concept Comparison

  • In SQL Server, a clustered index defines the physical order of data in a table. In BigQuery, clustering refers to the organization of data within partitions based on one or more columns. Clustering in BigQuery does not impact the physical storage order like a clustered index in SQL Server

  • Both SQL Server and BigQuery support table partitioning. The purpose is similar, allowing for better data management and performance optimization

Install System Requirements and Frameworks

Before looking at the code, we need to setup our environment with all the necessary dependencies, so we can build our models.

Requirements

👉 Verify that there are files on the data lake. If not, run the data pipeline process to download the files into the data lake.

👉 Clone this repo or copy the files from this folder, dbt and sql.

  • Must have CSV files in the data lake
  • Create a dbt cloud account
    • Link dbt with your GitHub project (Not needed when running locally)
    • Create schedule job on dbt cloud for every Saturday 9am
    • Or install locally (VM) and run from CLI
  • GitHub account
  • Google BigQuery resource

Configure the CLI

Install dbt core and BigQuery dependencies

Run these command from the Step4-Data-Warehouse/dbt folder to install the dependencies and initialize the project.

$ cd Step4-Data-Warehouse/dbt
$ pip install dbt-core dbt-bigquery  
$ dbt init
$ dbt deps
Create a profile file

From the Step4-Data-Warehouse folder, run the following commands.

$ cd ~
$ mkdir .dbt
$ cd .dbt
$ touch profiles.yml
$ nano profiles.yml
  • Paste the profiles file content

👉 Use your dbt cloud project project information and cloud key file

  • Run this command see the project folder configuration location
$ dbt debug --config-dir
  • Update the content of the file to match your project information
Analytics:
  outputs:
    dev:
      dataset: mta_data
      job_execution_timeout_seconds: 300
      job_retries: 1
      keyfile: /home/.gcp/your-file.json
      location: us-east1
      method: service-account
      priority: interactive
      project: your-gcp-project
      threads: 2
      type: bigquery
  target: dev
Validate the project configuration

This should generate a list of all the assets that should be generated in the project including the constraints.

$ dbt list --profile Analytics

Review the Code

With a dev environment ready and clear specifications about how to build the models and our transformations, we can now look at the code and review the approach. We can use Visual Studio Code or a similar tool to edit the source code and open a terminal to run the CLI commands.

Start by navigating to the dbt project folder.

$ cd Step4-Data-Warehouse/dbt

Project tree:

- dbt
  │
  ├─ models
  │   │
  │   ├─ core
  │   │   ├─ schema.yml
  │   │   ├─ dim_booth.sql
  │   │   ├─ dim_station.sql
  │   │   ├─ fact_turnstile.sql
  │   │   └─ ...
  │   ├─ staging
  │   │   ├─ schema_*.yml
  │   │   ├─ stg_booth.sql
  │   │   ├─ stg_station.sql
  │   │   ├─ stg_turnstile.sql
  │   │   └─ ...  
  │   ├─ target
  │   │   ├─ compile
  │   │   ├─ run
  │   │   └─ ...  
  └─ dbt_project.yml

The dbt folder contains the SQL-based source code. The staging folder contains the view definitions. The core folder contains the table definitions. The schema files in those folders have test rules and data constraints that are used to validate the models. This is how we are able to test our models.

The schema.yml files are used as configurations to define the schema of the final output of the models. It provides the ability to explicitly specify the column names, data types, and other properties of the resulting table created by each dbt model. This file allows dbt to generate the appropriate SQL statements for creating or altering tables in the target data warehouse.

👍 All these files are executed using the dbt CLI. The files are compiled into SQL statements that are deployed to the database or just executed in memory to run the test, validation and insert scripts. The compiled SQL is stored in the target folder and these are assets deployed to the database. The transformation tasks are compiled into the run folder and are only executed on the database.

Lineage

Data lineage is the documentation and tracking of the flow of data from its origin to its destination, including all the intermediate processes and transformations that it undergoes. In this case, we show how the external table is the source for the fact table and the dimension table dependencies.

ozkary-data-engineering-data-warehouse-lineage

Staging Data Models - Views

We use the view strategy to build our staging models. When these files are executed (via CLI commands), the SQL DDL (Data Definition Language) is generated and deployed to the database, essentially building the views. We also add a test parameter to limit the number of rows to 100 during the development process only. This is removed when it is deployed. Notice how the Jinja directives are in double brackets {{}} and handle some conditional logic and directives to configure the build process or call user defined functions.

👍 DDL (Data Definition Language) is used to create objects. DML (Data Manipulation Language) is used to query the data.

  • stg_station.sql
{{ config(materialized='view') }}

with stations as 
(
  select 
    Station,
    row_number() over(partition by Station) as rn
  from {{ source('staging','ext_turnstile') }}   
  where Station is not null
)
select
    -- create a unique key based on the station name
    {{ dbt_utils.generate_surrogate_key(['Station']) }} as station_id,    
    Station as station_name
from stations
where rn = 1

-- use is_test_run false to disable the test limit
-- dbt build --m <model.sql> --var 'is_test_run: false'
{% if var('is_test_run', default=true) %}
  limit 100
{% endif %}
  • stg_booth.sql
{{ config(materialized='view') }}

with booths as 
(
  select
    UNIT,
    CA,
    Station,
    row_number() over(partition by UNIT, CA) as rn
  from {{ source('staging','ext_turnstile') }}   
  where Unit is not null and CA is not null and Station is not null
)
select
    -- create a unique key 
    {{ dbt_utils.generate_surrogate_key(['UNIT', 'CA']) }} as booth_id,
    UNIT as remote,
    CA as booth_name,
    Station as station_name
from booths
where rn = 1

-- dbt build --m <model.sql> --var 'is_test_run: false'
{% if var('is_test_run', default=true) %}

  limit 100

{% endif %}
  • stg_turnstile.sql

{{ config(materialized='view') }}

with turnstile as 
(
  select     
  CA,
  UNIT,
  STATION,
  concat(CA,UNIT,SCP) as REF,
  SCP,
  LINENAME,
  DIVISION,
  concat(log.DATE," ", log.TIME) as CREATED,
  ENTRIES,
  EXITS,
    row_number() over(partition by CA, UNIT, SCP, DATE, TIME) as rn
  from {{ source('staging','ext_turnstile') }} as log
  where Station is not null and DATE is not null and TIME is not null

)
select
    -- create a unique key 
    {{ dbt_utils.generate_surrogate_key(['REF', 'CREATED']) }} as log_id,
    CA as booth,
    UNIT as remote,
    STATION as station,

    -- unit and line information
    SCP as scp,
    LINENAME AS line_name,
    DIVISION AS division,

     -- timestamp
    cast(CREATED as timestamp) as created_dt,    

    -- measures
    cast(entries as integer) as entries,
    cast(exits as integer) as exits    
from turnstile
where rn = 1


-- dbt build --m <model.sql> --var 'is_test_run: false'
{% if var('is_test_run', default=true) %}
  limit 100
{% endif %}

Physical Data Models - Tables

We use the incremental strategy to build our tables. This enable us to continuously append data to our tables when there is new information. This strategy creates both DDL and DML scripts. This enable us to build the tables and also create the scripts to merge the new data in the table.

We use the models (views) to build the actual tables. When these scripts are executed (via CLI commands), the process checks if the object exists, if it does not exists, it creates it. It then reads the data from the views using CTE (common table expressions) and appends all the records that are not already in the table.

  • dim_station.sql

{{ config(materialized='incremental') }}

with stations as (
select 
    station_id, 
    station_name    
from {{ ref('stg_station') }} as d
where station_id is not null
)
select
    ns.station_id,
    ns.station_name
from stations ns
{% if is_incremental() %}
     -- logic for incremental models this = dim_station table
    left outer join {{ this }} dim
        on ns.station_id = dim.station_id
    where dim.station_id is null     

 {% endif %}
  • dim_booth.sql

{{ config(materialized='incremental',
   cluster_by = "station_id"
 )}}

with booth as (
select 
    booth_id,
    remote,
    booth_name,
    station_name
from {{ ref('stg_booth') }}
where booth_id is not null 
),

dim_station as (
    select station_id, station_name from {{ ref('dim_station') }}   
)
select 
    b.booth_id,
    b.remote,
    b.booth_name,
    st.station_id
from booth b 
inner join dim_station st 
    on b.station_name = st.station_name
{% if is_incremental() %}
     -- logic for incremental models this = dim_booth table
    left outer join {{ this }} s
        on b.booth_id = s.booth_id
    where s.booth_id is null     
 {% endif %}
  • fact_turnstile.sql

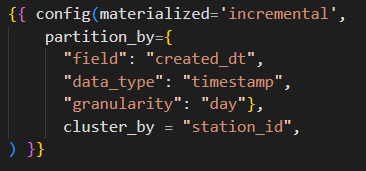
{{ config(materialized='incremental',
    partition_by={
      "field": "created_dt",
      "data_type": "timestamp",
      "granularity": "day"
    },
    cluster_by = "station_id") 
}}

with turnstile as (
    select 
        log_id,
        remote,
        booth,
        station,
        scp,
        line_name,
        division,
        created_dt,
        entries,
        exits
    from {{ ref('stg_turnstile') }}
    where log_id is not null
), 

dim_station as (
    select station_id, station_name from {{ ref('dim_station') }}   
),

dim_booth as (
    select booth_id, remote, booth_name  from {{ ref('dim_booth') }}   
)
select 
    log.log_id,
    st.station_id,
    booth.booth_id,
    log.scp,
    log.line_name,
    log.division,
    log.created_dt,
    log.entries,
    log.exits
from turnstile as log
left join dim_station as st
   on log.station = st.station_name
left join dim_booth as booth
on log.remote = booth.remote and log.booth = booth.booth_name 
{% if is_incremental() %}
     -- logic for incremental models this = fact_turnstile table
    left outer join {{ this }} fact
        on log.log_id = fact.log_id
    where fact.log_id is null     

 {% endif %}
  • schema.yml
version: 2

models:
  - name: dim_station
    description: >
      List of unique stations identify by station_id.       
    columns:
          - name: station_id
            description: The station identifier            
            tests:
                - unique:
                    severity: warn
                - not_null:
                    severity: warn
          - name: station_name
            description: the station name
            tests:
                - not_null:
                    severity: warn

  - name: dim_booth
    description: >
      List of unique booth identify by booth_id.  
    columns:
          - name: booth_id
            description: The booth identifier            
            tests:
                - unique:
                    severity: warn
                - not_null:
                    severity: warn
          - name: remote
            description: the remote gate name
            tests:
                - not_null:
                    severity: warn
          - name: booth_name
            description: the station booth
            tests:
                - not_null:
                    severity: warn
          - name: station_id
            description: the station id
            tests:
                - relationships:
                  to: ref('dim_station')
                  field: station_id
                  severity: warn              
  - name: fact_turnstile
    description: >
     Represents the daily entries and exits associated to booths in subway stations
    columns:
          - name: log_id
            description: Primary key for this table, generated with a concatenation CA, SCP,UNIT, STATION CREATED            
            tests:
                - unique:
                    severity: warn
                - not_null:
                    severity: warn
          - name: booth_id
            description: foreign key to the booth dimension            
            tests:
               - relationships:
                  to: ref('dim_booth')
                  field: booth_id
                  severity: warn
          - name: station_id          
            description:  The foreign key to the station dimension            
            tests:
               - relationships:
                  to: ref('dim_station')
                  field: station_id
                  severity: warn
          - name: scp
            description: The device address
          - name: line_name
            description: The subway line
          - name: division
            description: The subway division          
          - name: created_dt
            description: The date time for the activity
            tests:
                - not_null:
                    severity: warn
          - name: entries
            description: The number of entries
            tests:
                - not_null:
                    severity: warn
          - name: exits
            description: the number of exits 
            tests:
                - not_null:
                    severity: warn

Incremental Models

In dbt, an incremental model uses a merge operation to update a data warehouse's tables incrementally rather than performing a full reload of the data each time. This approach is particularly useful when dealing with large datasets and when the source data has frequent updates or inserts. Incremental models help optimize data processing and reduce the amount of data that needs to be processed during each run, resulting in faster data updates.

  • SQL merge query for the station dimension table (generated code)

merge into `ozkary-de-101`.`mta_data`.`dim_station` as DBT_INTERNAL_DEST
using (

  with stations as (
  select 
      station_id, 
      station_name    
  from `ozkary-de-101`.`mta_data`.`stg_station` as d
  )
  select
      ns.station_id,
      ns.station_name
  from stations ns
  -- logic for incremental models
  left outer join `ozkary-de-101`.`mta_data`.`dim_station` s
      on ns.station_id = s.station_id
  where s.station_id is null     
  -- 
    ) as DBT_INTERNAL_SOURCE
    on (FALSE)  
when not matched then insert
    (`station_id`, `station_name`)
values
    (`station_id`, `station_name`)
  • SQL merge query for the fact table (generated code)
merge into `ozkary-de-101`.`mta_data`.`fact_turnstile` as DBT_INTERNAL_DEST
using (

    with turnstile as (
        select 
            log_id,
            remote,
            booth,
            station,
            scp,
            line_name,
            division,
            created_dt,
            entries,
            exits
        from `ozkary-de-101`.`mta_data`.`stg_turnstile`
        where log_id is not null
    ), 

    dim_station as (
        select station_id, station_name from `ozkary-de-101`.`mta_data`.`dim_station`   
    ),

    dim_booth as (
        select booth_id, remote, booth_name  from `ozkary-de-101`.`mta_data`.`dim_booth`   
    )
    select 
        log.log_id,
        st.station_id,
        booth.booth_id,
        log.scp,
        log.line_name,
        log.division,
        log.created_dt,
        log.entries,
        log.exits
    from turnstile as log
    left join dim_station as st
      on log.station = st.station_name
    left join dim_booth as booth
    on log.remote = booth.remote and log.booth = booth.booth_name 

    -- logic for incremental models this = fact_turnstile table
    left outer join `ozkary-de-101`.`mta_data`.`fact_turnstile` fact
        on log.log_id = fact.log_id
    where fact.log_id is null     

    ) as DBT_INTERNAL_SOURCE
    on (FALSE)
    when not matched then insert
        (`log_id`, `station_id`, `booth_id`, `scp`, `line_name`, `division`, `created_dt`, `entries`, `exits`)
    values
        (`log_id`, `station_id`, `booth_id`, `scp`, `line_name`, `division`, `created_dt`, `entries`, `exits`)

How to Run It

We are ready to see this in action. We first need to build the data models on our database by running the following steps:

Validate the project

Debug the project to make sure there are no compilation errors.

$ dbt debug

Run the test cases

All test should pass.

$ dbt test
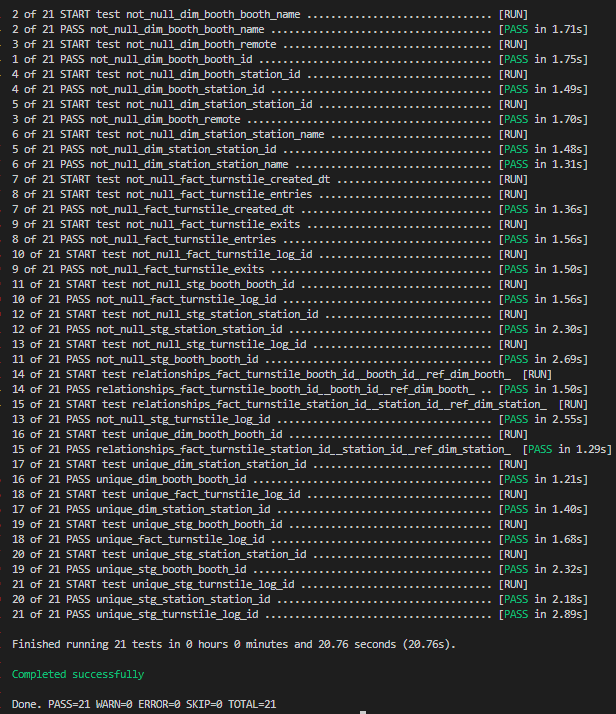
ozkary-data-engineering-data-warehouse-tests

Build the models

Set the test run variable to false. This allows for the full dataset to be created without limiting the rows.

$ cd Step4-Data-Warehouse/dbt
$ dbt build --select stg_booth.sql --var 'is_test_run: false'
$ dbt build --select stg_station.sql --var 'is_test_run: false'
$ dbt build --select stg_turnstile.sql --var 'is_test_run: false'

$ dbt build --select dim_booth.sql 
$ dbt build --select dim_station.sql 
$ dbt build --select fact_turnstile.sql

After running these command, the following resources should be in the data warehouse:
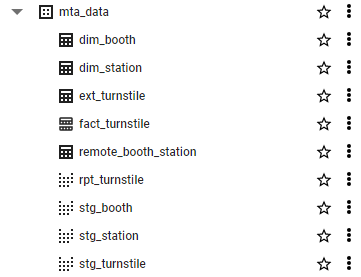
ozkary-data-engineering-data-warehouse-schema

👍 The build command is responsible for compiling, generating and deploying the SQL code for our dbt project, while the run command executes that SQL code against your data warehouse to update the data. Typically, we would run dbt build first to compile the project, and then run dbt run to execute the compiled code against the database.

Generate documentation

Run generate to create the documentation. We can then run serve to view the documentation on the browser.

$ dbt docs generate
$ dbt docs serve

The entire project is documented. The image below shows the documentation for the fact table with the lineage graph showing how it was built.
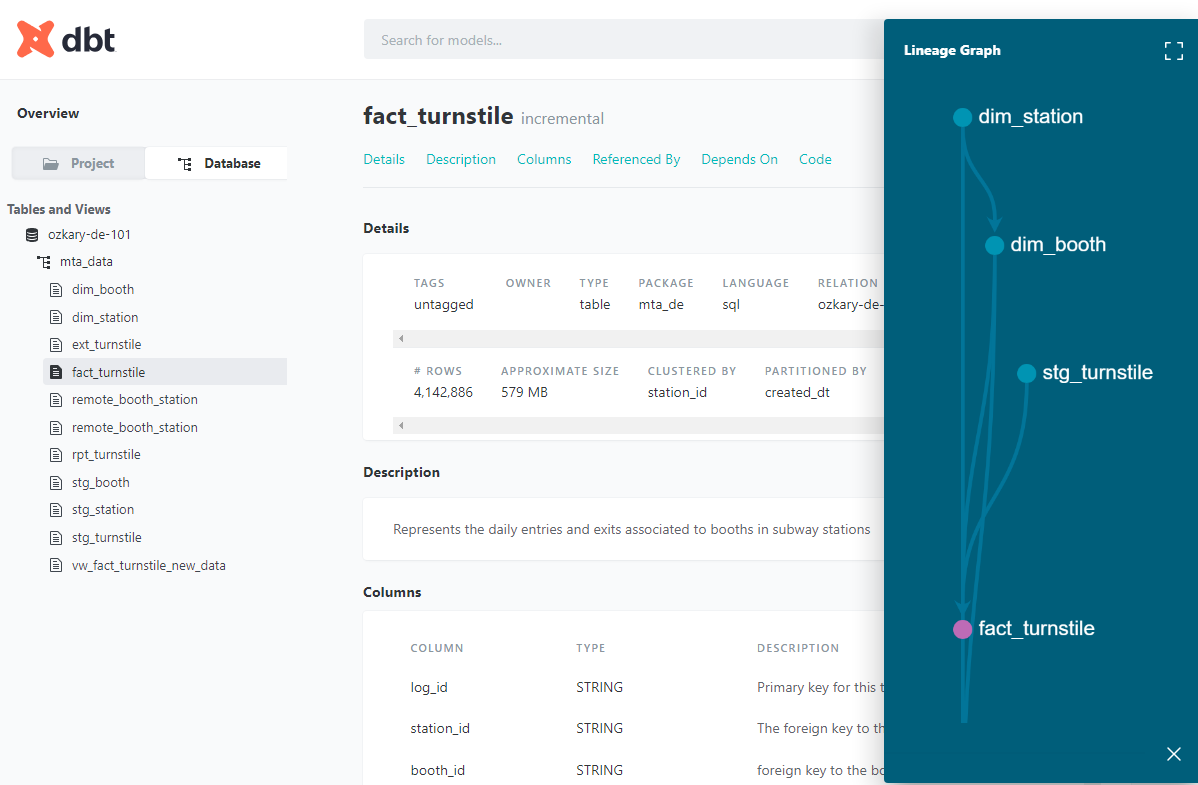
ozkary-data-engineering-data-warehouse-docs

Manually test the incremental updates

We can run our updates on demand by using the CLI. To be able to run the updates. We should first run the data pipeline and import a new CSV file into the data lake. We can then run our updates as follows:

$ cd Step4-Data-Warehouse/dbt
$ dbt run --model dim_booth.sql 
$ dbt run --model dim_station.sql 
$ dbt run --model fact_turnstile.sql

We should notice that we are "running" the model, which only runs the incremental (merge) updates.

Schedule the job

Login to dbt cloud and set this scheduled job:

  • On dbt Cloud setup the dbt schedule job to run every Saturday at 9am
  • Use the production environment
  • Use the following command
$ dbt run --model fact_turnstile.sql

After running the cloud job, the log should show the following information with the number of rows affected.
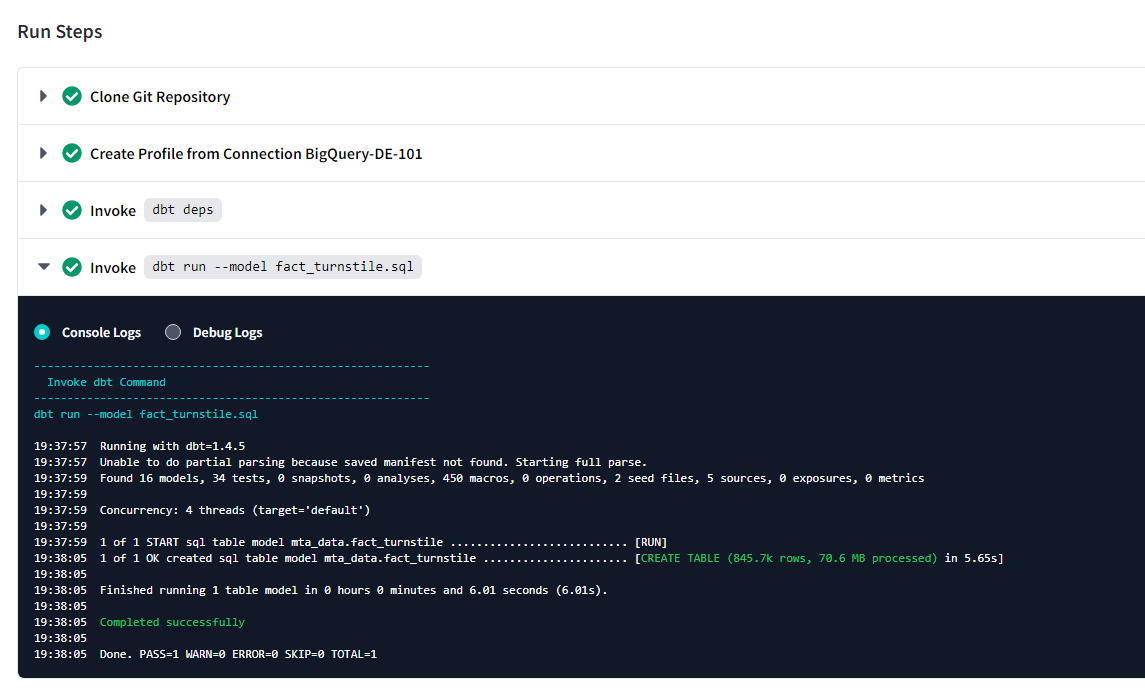
ozkary-data-engineering-data-warehouse-job

👍 There should be files on the data lake for the job to insert any new records.

Manually Query the data lake for new data

To test the for new records, we can manually run this query on the database.

with turnstile as (
    select 
        log_id      
    from mta_data.stg_turnstile
)
select 
    log.log_id    
from turnstile as log
-- logic for incremental models find new rows that are not in the fact table
left outer join mta_data.fact_turnstile fact
    on log.log_id = fact.log_id
where fact.log_id is null

Validate the data

To validate the number of records in our database, we can run these queries:

-- check station dimension table
select count(*) from mta_data.dim_station;

-- check booth dimension table
select count(*) from mta_data.dim_booth;

-- check the fact table
select count(*) from mta_data.fact_turnstile;

-- check the staging fact data
select count(*) from mta_data.stg_turnstile;

After following all these instructions, we should see data in our data warehouse, which closes the loop on the entire data pipeline for data ingestion from a CSV file to our data warehouse. We should also note that we could have done this process using a Python-Centric approach with Apache Spark, and we will discuss that in a later section.

Summary

During this data warehouse exercise, we delve into the design and implementation step, crafting robust data models, and designing transformation tasks. Carefully selecting a star schema design and utilizing BigQuery as our OLAP system, we optimize performance and handle large datasets efficiently. Leveraging SQL for coding and a SQL-Centric framework, we ensure seamless data modeling and transformation. We use GitHub for our source code management and CI/CD tool integration, so the latest changes can be built and deployed. Thorough documentation and automated data transformations underscore our commitment to data governance and streamlined operations. The result is a resilient and future-ready data warehouse capable of meeting diverse analytical needs.

Next Step

With our data warehouse design and implementation complete, we have laid a solid foundation to unleash the full potential of our data. Now, we venture into the realm of data analysis and visualization, where we can leverage powerful tools like Power BI and Looker to transform raw data into actionable insights.

Coming Soon!

👉 [Data Engineering Process Fundamentals - Data Analysis and Visualization]

Thanks for reading.

Send question or comment at Twitter @ozkary

👍 Originally published by ozkary.com